


msFineAnalysis AI Unknown Compounds Structure Analysis Software Model:msFineAnalysis AI
Advanced AI technologies enable structure analysis of unknown compounds
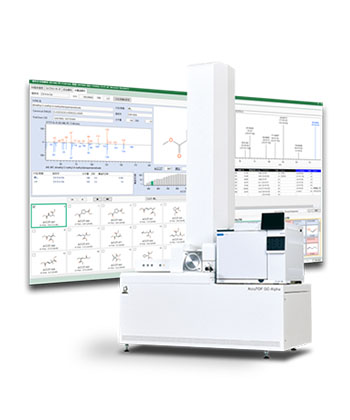
msFineAnalysis AI offers a new structure analysis tool for unknowns that is specifically designed for the JEOL JMST2000GC "AccuTOF™ GC-Alpha." This next generation software adds this structure analysis capability to improve the overall automatic qualitative analysis functionality that was already available with our previous generation msFineAnalysis.
The new "integrated analysis" combines GC/EI high resolution data, GC/soft ionization high resolution data, and "structure analysis" using two AIs (Main AI, Support AI). These advanced AI technologies allow msFineAnalysis AI to provide a unique automatic structure analysis capability that was not previously available for GC-MS qualitative analysis.
-
AI Structure Analysis
■ Evolving innovative solutions: From molecular formula estimation to structural formula prediction for unknown compoundsFor an unknown compound that is not registered in a library database (▼), the conventional msFineAnalysis algorithms automatically suggest a molecular formula. To take it a step further, msFineAnalysis AI enables automatic prediction of structures for all detected components.
■ The necessity for soft ionization: Reliable acquisition of molecular formula information is the first step in structure analysis!
EI mass spectral data is used for library databases so EI methods are widely used for qualitative analysis of GC-MS samples. However, since EI is a hard ionization method, many fragment ions are observed, and in many cases, it is not uncommon to observe minimal or no signal for the molecular ions.
Additionally, for unknown substances not registered in the library databases, it is difficult to distinguish, using the EI mass spectra alone, whether the largest observed m/z is actually the molecular ion or just a fragment ion. In these cases, a soft ionization method is an effective tool for determining this information.
With the AccuTOF™ GC-Alpha, a variety of soft ionization methods including FI, PI, and CI are optionally available with the system. These techniques can assist in distinguishing ions (e.g. molecular ions and protonated molecules) that provide molecular weight information that then makes it possible to accurately determine the molecular formula information for unknown components.
Since molecular formula information is an important starting point for AI structure analysis, soft ionization is critically important for identifying unknown compounds.
Mass spectrum of component not registered in library
■ Manual Structure Analysis by Skilled Analyst vs. AI Automatic Structure Analysis
※ Measured with JMS-T2000GC standard configuration PC
The time required for structure analysis was compared for the compounds observed in an acrylic resin measured by Py-GC-TOFMS and were not registered in the NIST library database.
Even an analyst with more than 30 years mass spectrometry experience required approximately 2 hours for structure analysis of 4 components, which is 30 minutes per component. On the other hand, AI structure analysis completed 100 components in less than 7 minutes, which is 4 seconds per component.
AI structure analysis score (similarity) between the structural formula estimated by a skilled analyst and the correct structural formula, indicating that the structural formula is predicted with good similarity.
■ Automatic Structure Analysis Using Two AIs:
Stable structure analysis without the need for an online envir onment
msFineAnalysis AI offers an automated structure analysis function.
Based on the structural formula information of more than 100 million organic compounds recognized in the world and calculations using two newly developed AI models, it provides candidate structural formulas even for components that are not registered in the library database.

■ AI Structure Analysis Prediction Accuracy
The NIST20 library database is used by the Main AI employed in AI structure analysis for learning and evaluation.
The prediction accuracy tests confirmed that the correct structure was in the top 1% for 73% of the compounds, and in the top 10% for 93% of the compounds.

Structures with the same composition formula as the target compounds (14581 compounds) are prepared from PubChem. The rank order of the correct structure is verified among them.
Of the 14581 compounds verified, the correct structure was obtained within top 1% rank order in 73% ( 10644 compounds).
Subsequently, 6 known compounds that were not registered in the NIST20 library database were analyzed, and the correct structure was ranked highest for three compounds. For the remaining compounds, the top structures listed in the structure analysis results all shared similar features with the correct formula.

■ AI Structure Analysis Application
The AI structure analysis results for an acrylic resin measured by Py-GC-HRTOFMS are shown below. For the 20 compounds that had structures that could not be confirmed with the NIST20 library database, AI structure analysis was performed after determining their molecular formula through integrated analysis.
All of these compounds had structures that included methyl esters (reflecting the acrylic resin monomer structure) shown for the higher ranked possibilities. This information allowed us to estimate that all of the compounds targeted for structure analysis are acrylic resin thermal decomposition products.


Deconvolution Detection
Chromatographic peak deconvolution can detect trace components that may not be obvious in the TICC due to the coelution of several components. EI: black solid line: TICC, gray peaks: deconvolution peak (blue: currently selected)
FI: green solid line: TICC, gray peaks: deconvolution peak (blue: currently selected)
This step simplifies the data analysis process by defining which ions go with each compound and eliminates the need for creating extracted ion chromatograms (EICs).
Retention Index Qualitative Analysis
Retention index (RI) is a relative index value based on the retention times (RT) for an n-alkane standard mixture. Retention Index Creation Screen
This qualitative analysis function is performed by converting the RT of the target component into a RI and then comparing it with the RI value listed in the databases, etc. With msFineAnalysis AI, it is possible to narrow down the qualitative analysis result further by using the RI.
Two Sample Comparison (Differential Analysis)
This function uses the reproducibility of the p-value on the vertical axis and a volcano plot which indicates the intensity ratio between two samples on the horizontal axis. Detailed analysis – Volcano plot
(A: Reference product, B: Defective product)
This information enables a visual confirmation of the differing components between two samples. For example, it is possible to confirm if a component increases or decreases when comparing a reference product to a defective product or to identify characteristic components in a new material by comparing it to an existing material. For a two sample comparison, it is possible to set n=1, 3, 5 for the number of measurements for each sample.
msFineAnalysis AI Analysis Flow
-
- Automatically detecting peaks and creating mass spectra
- Creating mass spectra by manual peak detection
- Creating mass spectra by deconvolution processing
- Analyzing identical components of two measurement data items
- Analyzing molecular ions according to two mass spectra
- Variance component analysis
- Displaying analysis results using retention indices
- Displaying NIST database search results
- Displaying exact mass calculation results
- Displaying isotope pattern analysis results
- Displaying measurement conditions
- User interface: English
Related Products
-

msFineAnalysis iQ integrated qualitative analysis software
Model:msFineAnalysis iQ
-

msRepeatFinder Polymer Analysis Software
Model:msRepeatFinder